Moments That Make the Beat Go On: Part 2
Moments That Make the Beat Go On: Part 2
by Chidera Alim
For good context and background, be sure to go through the first part of the series, Moments That Make the Beat Go On: Part 1.
Studying Calcium Dynamics

In research labs, we can investigate cardiovascular diseases by observing Ca2+ dynamics on a cellular level using calcium fluorescent indicators. The calcium indicator or calcium dye of choice must have a high Ca2+ affinity and be sensitive to low Ca2+ concentrations. Fluorescent signal intensity reveals changes in Ca2+ concentrations (see Fluorescent Techniques blog for more on fluorescence). Fura-2 and Fluo-4 are commonly used high-affinity Ca2+ indicators. These dyes can be loaded into cardiomyocytes by simply incubating the cells with the dye solution for a specific period of time based on producer recommendation (Figure 1).
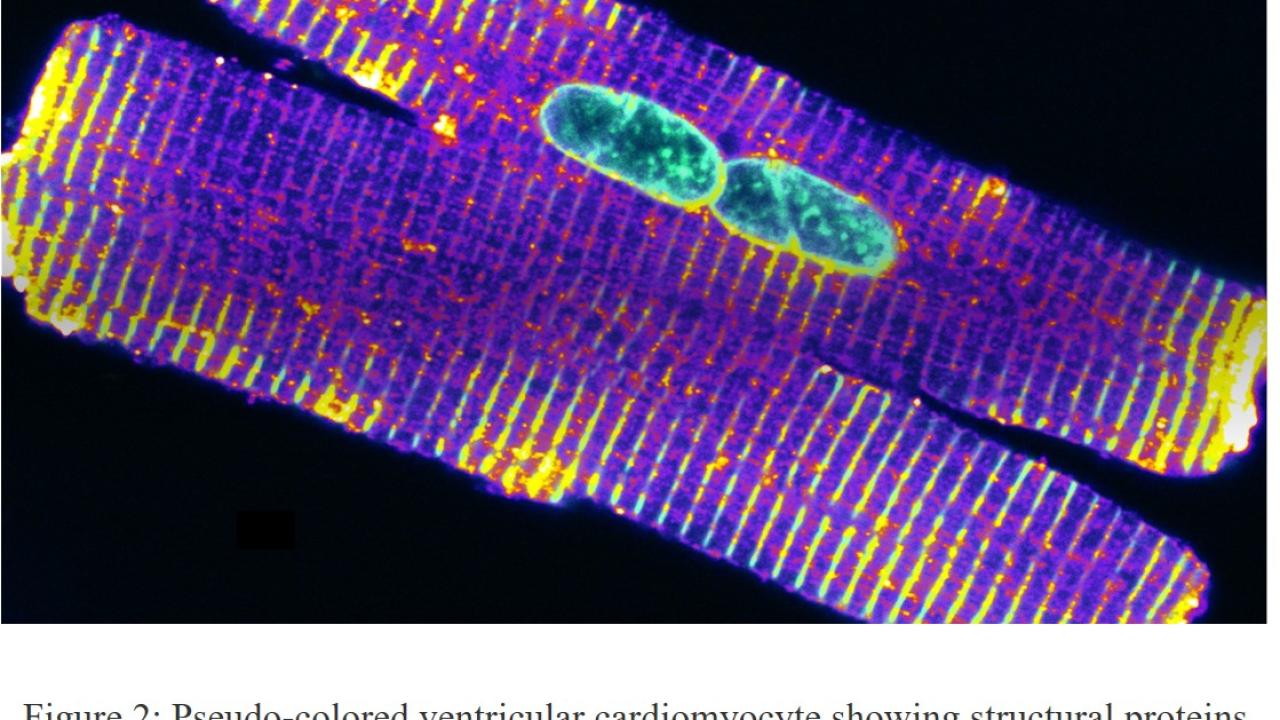
While the calcium dye used in these studies fluoresces green (based on GFP emission wavelength), images can be pseudo colored for presentation purposes (Figure 2). The cardiomyocytes used for research experiments are obtained from experimental animal models. The hearts from these animals are excised and the left ventricular myocytes are enzymatically isolated for experiments. You may notice a lot of studies focus on left ventricles. This is because the left ventricle has to generate enough force to eject blood to ALL systems. In comparison, the right ventricle only pumps blood to the lungs (for oxygenation).

We can electrically stimulate action potentials (Video 1) and observe the transient rise in Ca2+ with each heartbeat on a microscope. If we draw a line (or a region of interest) that spans the length of the cardiomyocyte contracting in Video 1, we can take images in rapid successions.
The images can then be quantified using any of several imaging software (like FIJI/ImageJ) and then analyzed (Video 2). The transients in the lower panel are similar to the EKG readings observed in hospitals – except we have just “one lead” instead of three or more. Ca2+ activities vary in a healthy cardiomyocyte and a failing cardiomyocyte; Video 3 is a representation of arrhythmia. The advent of the laser scanning confocal microscope made it possible for the discovery of Ca2+ sparks in cardiac myocytes (Cheng et al., 1993). These sparks are the elementary events of CICR from the SR – discussed in the introductory blog. During EC coupling, Ca2+ influx through the L-type Ca2+ channel evokes the synchronous release of tens of thousands of sparks – this is what we see as a transient. In mice for example, when the cardiomyocyte is at rest, some Ca2+ might “leak” out of the SR. Excessive Ca2+ leak or sparks is a characteristic of heart disease. Mutations in the L-type Ca2+ channel, SR or RYR for example, can lead to early or delayed depolarizations and ultimately ventricular arrhythmias.
Interested in learning more? You can read up on “Cardiovascular Electrophysiology” or “Calcium signaling and cardiac arrhythmias”.
Alternatively, here are some research articles for a deeper dive:
- Cardiac Excitation–Contraction Coupling
- Calcium Sparks
- Calcium Waves
- Calcium and the Heart: A Question of Life and Death
Reference
Cheng, H., Lederer, W. J. & Cannell, M. B. Calcium sparks: Elementary events underlying excitation-contraction coupling in heart muscle. Science (80-. ). 262, 740–744 (1993).
