Modern-Day Fluorescent Techniques in Research
Modern-Day Fluorescent Techniques in Research
by Chidera Alim
Fluorescence microscopy techniques have been used extensively for both research and diagnostic purposes. Recent advances in fluorescence microscopy have enabled detailed investigation and understanding of life on an intracellular level. This originates from tools and techniques that allow visualization of molecular signaling events. Before we discuss these techniques, let’s briefly review the concept of fluorescence.
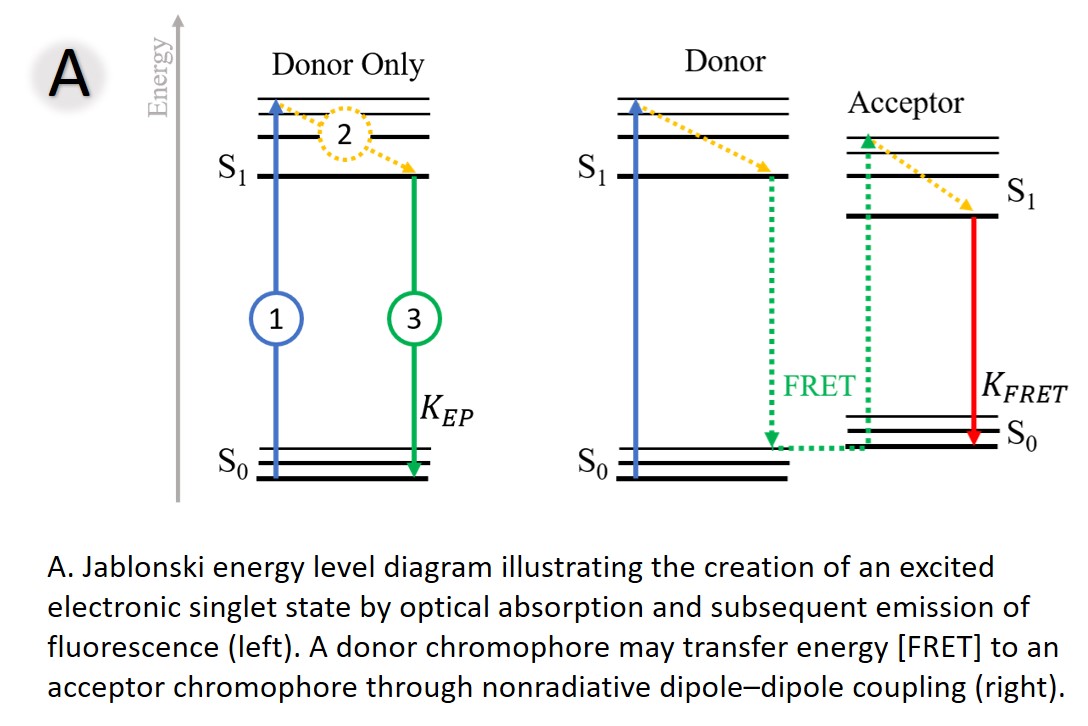
Fluorescence is the phenomenon in which a molecule absorbs light, and subsequently emits light of a different, typically longer, wavelength. It results from a three-stage process that occurs in certain molecules (generally polyaromatic hydrocarbons or heterocycles) called fluorophores or fluorescent dyes. First, excitation – energy is supplied from a lamp or laser to excite our fluorophore to an “excited” state. Second, the excited-state lifetime – the fluorophore loses some energy while relaxing and interacting with its new environment. Third, fluorescence emission – the fluorophore releases all its energy (emits light), returning to its ground state (Figure A - left).

A fluorescent probe or tag is a fluorophore that is attached chemically to aid the detection of a biological specimen such as proteins or antibodies. Fluorescent probes enable researchers to detect specific components of complex biomolecular assemblies, such as live cells, with exquisite sensitivity and selectivity. With these probes, we can perform a variety of experiments using several techniques which would vary depending on the specific research question.
Fluorescence Resonance Energy Transfer
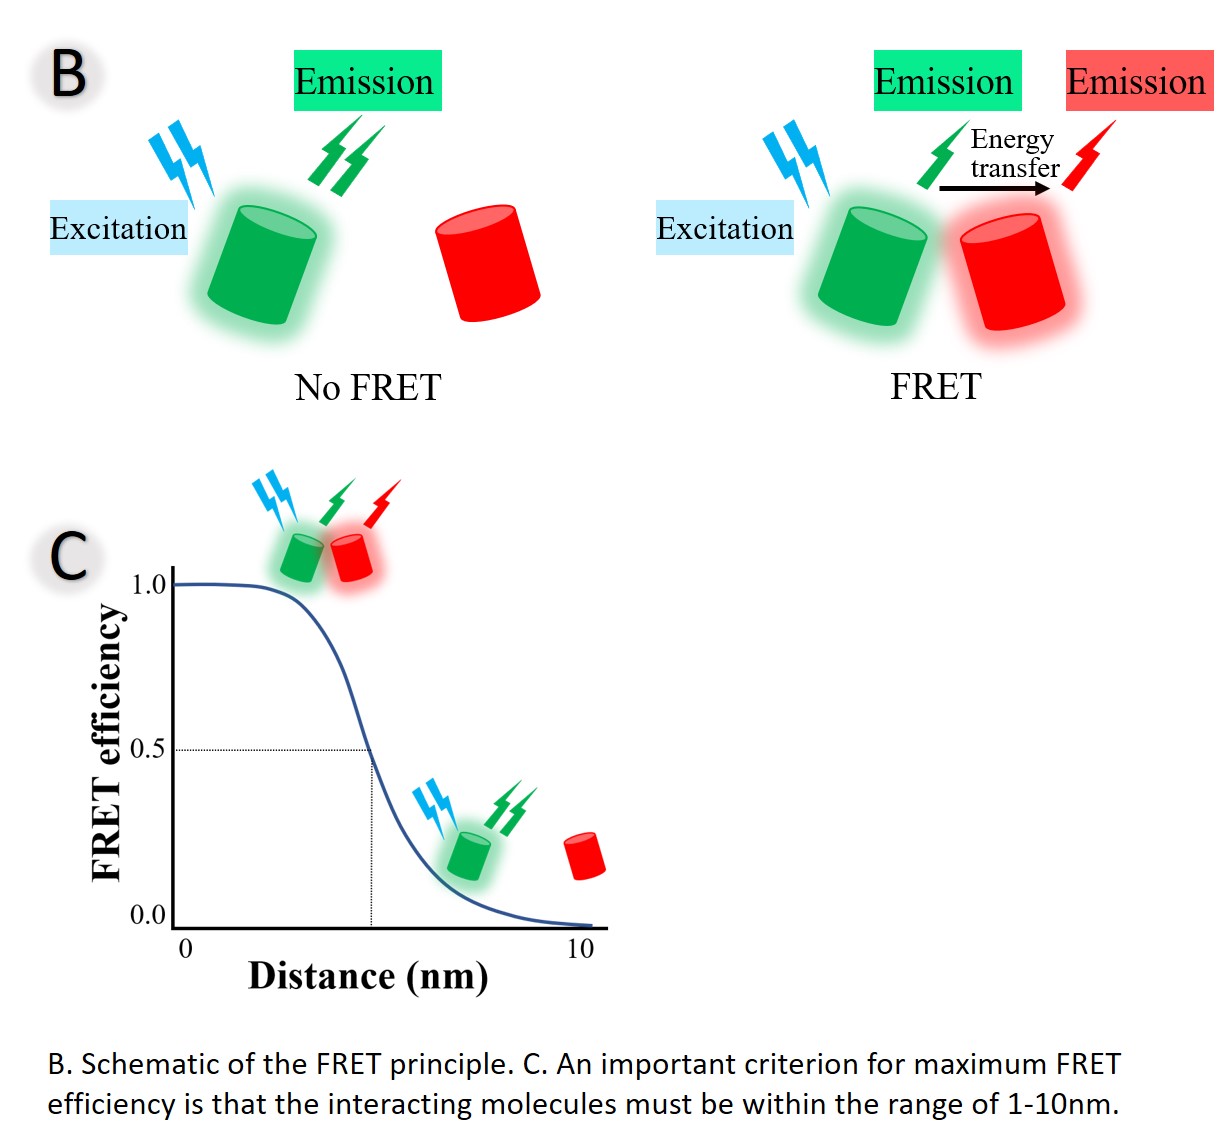
Imagine a protein that changes conformation when activated – from open to close for example. Alternatively, other proteins might transiently bind to a substrate or neighboring protein to activate or even inhibit them. With fluorescent probes, we can monitor these reactions, observing the effect of specific drug, temperature change, pH change and even stress on these proteins. Fluorescence Resonance Energy Transfer (FRET) is simply the transfer of fluorescent energy between two closely juxtaposed molecules (within 10nm of each other, see Figure B) – a donor and an acceptor. The energy transfer is dependent on the distance between the interacting molecules and can thus be used as a spectroscopic ruler and reporter (Figure C). With the aid of fluorescent probes, we can visually detect these spatial changes.

FRET involves two fluorescent species — a donor (our first protein tagged with a green fluorophore or GFP) and an acceptor (our second protein tagged with a yellow fluorophore or YFP). When the donor protein (with GFP) and the acceptor (with YFP) are not in close proximity, excitation of the donor results in only donor fluorescence (green arrow, green spectra). However, when the donor and acceptor proteins interact, FRET occurs and part of the donor’s energy is transferred to the acceptor1, decreasing donor fluorescence lifetime and intensity, while increasing acceptor fluorescence (Figure A). FRET is great for detecting protein–protein interactions in live cells.
Fluorescence Lifetime Imaging
The fluorescence lifetime of a fluorophore is a measure of the average time a fluorophore remains in the excited state after excitation2. For a homogenous population of molecules, the resulting fluorescence decay is a single exponential function. Fluorescence lifetime measurements are insensitive to instrument settings like laser intensity or detector gain and are largely independent of fluorophore concentration, photobleaching and light scattering. FLIM is used to discriminate different fractions of the same fluorophore in different states of interaction with its environment as it is dependent on environmental conditions such as ions, pH, oxygen content, and interactions with other proteins. Therefore, fluorescence lifetime imaging allows us to perform accurate ion concentration measurement and Fluorescence Resonance Energy Transfer (FRET) analysis.
Applications of FLIM
- Diagnosis of brain tumors: Endoscopic fluorescence lifetime imaging microscopy (FLIM) system has been applied to the intraoperative diagnosis of glioblastoma multiforme (GBM). Experiments conducted in three patients undergoing craniotomy for tumor resection demonstrate that FLIM-derived parameters allow for differentiation of normal cortex tissue from brain tumor based on the fluorescence lifetime 3.
- Observe metabolic differences in normal vs. cancer cells 4: Increase glycolysis in cancer cells can be observed as a decrease in NADH lifetime – using NADH and FAD as indicators of metabolism.
- Other applications include: to observe receptor phosphorylation/dephosphorylation or activation/inhibition. Phospholipid trafficking in cells. Membrane localization of viral proteins. Characterization of membrane fusion. Interaction of proteins in their native environment, like interaction of proteins related to Alzheimer’s disease.
FLIM-FRET measurements
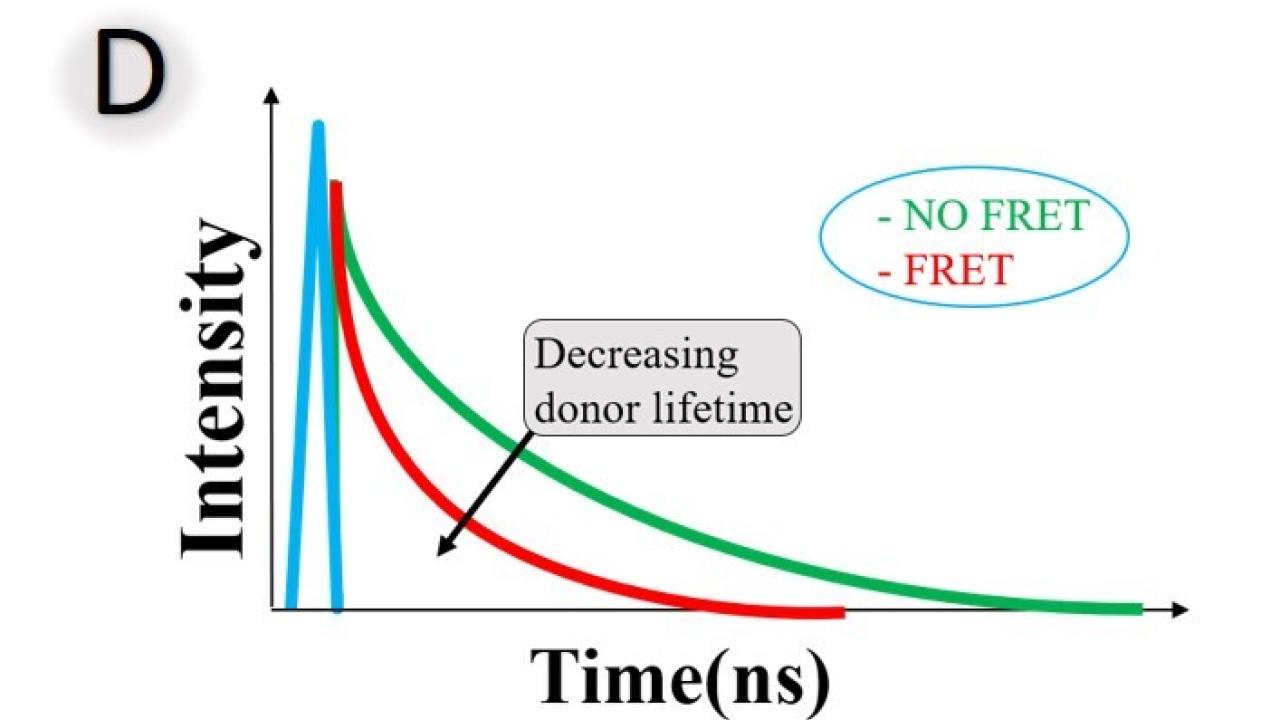
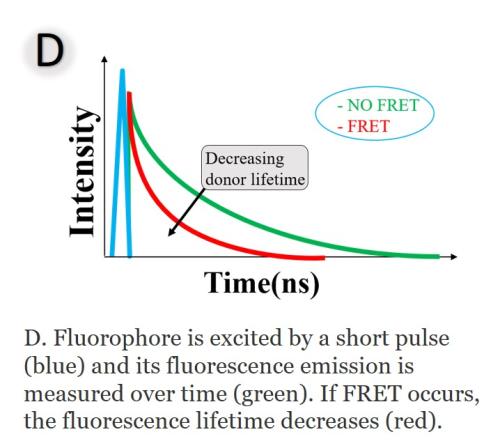
FLIM-FRET techniques are based on the measurement of the fluorescence lifetime of the donor. The FRET efficiency is obtained by comparing the fluorescence lifetimes of the donor in presence and absence of FRET (Figure D). The advantage of FLIM-based FRET measurement is that FLIM can distinguish between interacting and noninteracting donor fractions. The time constant of this function, the fluorescence lifetime (τ), is the reciprocal sum of the rate constants of all possible return paths: emitting a photon (EP), non-radiative relaxation (NR), and FRET.
No FRET: τdonor = 1KEP+KNR
With FRET: τdonor = 1KEP+KNR+KFRET
With FRET, there is an extra channel to depopulate the excited state by passing the energy to its molecular environment, the acceptor. The average lifetime is shorter with FRET given the additional rate of transfer for FRET. The rate constants, and thus the fluorescence lifetime, depend on the type of the molecule, its conformation and on the way the molecule interacts with its environment.

References
Becker, W., Bergmann, A., Suarez Ibarrola, R., Müller, P.-F. & Braun, L. Z. Metabolic imaging by simultaneous FLIM of NAD(P)H and FAD. in Multiphoton Microscopy in the Biomedical Sciences XIX (eds. Periasamy, A., So, P. T. & König, K.) vol. 10882 10 (SPIE, 2019).
Bunt, G. & Wouters, F. S. FRET from single to multiplexed signaling events. Biophysical Reviews vol. 9 119–129 (2017).
Meyer-Almes, F.-J. Fluorescence lifetime based bioassays. Methods Appl. Fluoresc. 5, 042002 (2017).
Sun, Y., Hatami, N. & Yee, M. Fluorescence lifetime imaging microscopy for brain tumor image-guided surgery. J. Biomed. Opt. 15, 056022 (2010).
